

The third quarter presented a mixed picture for investors, shaped by two powerful forces. Interest rates climbed to 20-year highs, while strong corporate earnings continued to provide support for equities. Against this backdrop, oil prices rose back above $100 per barrel, the Fed raised rates for the first time in three years, and concerns about AI mounted as November’s midterm election draws closer.
In spite of these crosscurrents, major U.S. stock indices finished the quarter near their all-time highs. Importantly, these gains extended beyond a single market segment. The energy sector, developed market equities, and commodities all contributed to portfolio performance during the quarter. And although the bond market faced headwinds from rising rates, bond yields now stand at some of their most compelling levels in recent memory.
These market dynamics serve as a reminder that a balanced portfolio is the foundation for navigating shifting market conditions, especially when those conditions create opportunities for long-term investing and financial planning. What steps can investors take to stay balanced as these forces continue to play out in the fourth quarter?
Key market and economic drivers in Q3 2026
• The S&P 500 returned 2.3% in the third quarter with dividends and the Nasdaq Composite gained 2.6%, while the Dow Jones Industrial Average declined -2.3%. Year-to-date, the three indices have returned 12.7%, 16.1%, and 7.2%, respectively.
• Developed market international stocks (MSCI EAFE) gained 0.9%, while emerging market stocks (MSCI EM) declined -0.4% over the quarter, both in U.S. dollar terms.
• The Bloomberg U.S. Aggregate Bond Index fell -3.5% in the third quarter for a year-to-date decline of -2.9%, with longer-dated bonds struggling. The 10-year Treasury yield climbed to 5.29%, a two-decade high.
• The Bloomberg Commodity Index jumped 15.1% over the quarter. Brent crude ended the quarter at $103 per barrel while WTI finished at $90.
• Gold fell further to $4,156 per ounce, while the U.S. Dollar Index recovered to 101.45.
• August headline Consumer Price Index (CPI) rose 3.4% year-over-year, while core CPI, which excludes volatile food and energy prices, increased only 2.4%. The core Personal Consumption Expenditures (PCE) price index, the Fed’s preferred measure of underlying inflation, rose 3.0% year-over-year in August.
• The Federal Reserve raised its key policy rate to a range of 3.75% to 4.00% in September.
• The third estimate of second quarter Gross Domestic Product (GDP) showed that growth was better than expected at 2.2% quarter-over-quarter. This was primarily driven by a 2.5% gain in personal consumption expenditures.
Investors are adapting to a higher interest rate environment
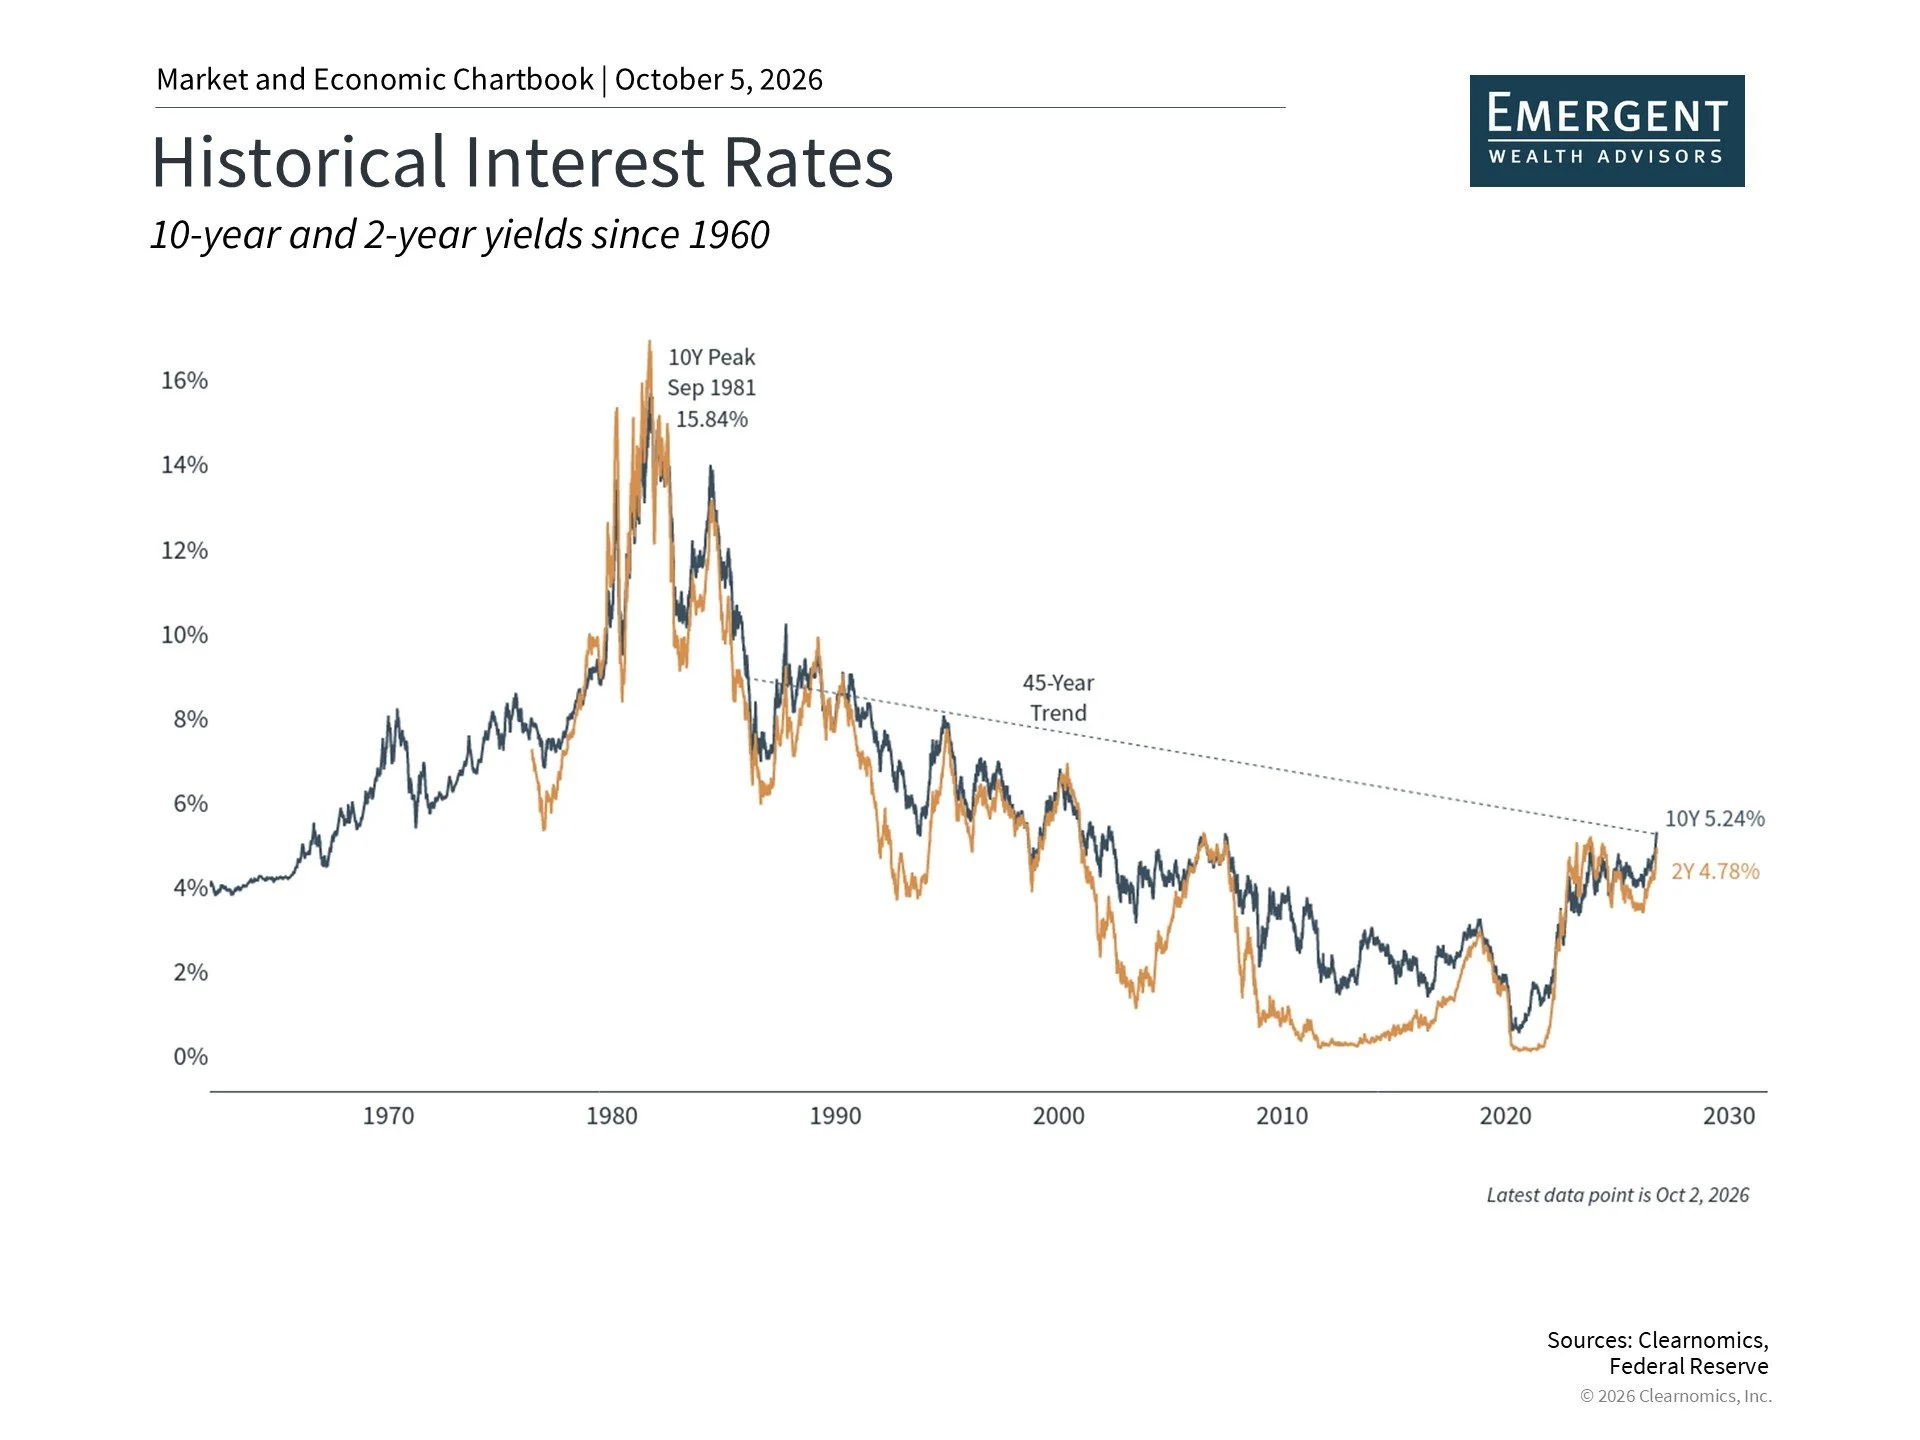
The most defining characteristic of the third quarter was the sustained rise in interest rates to levels not seen since the early 2000s. For long-term investors, this is significant because the low-rate environment that followed the 2008 global financial crisis is no longer the primary context for portfolio decisions. The ability of bonds to generate meaningful income today has become an important factor in asset allocation.
A historical perspective on interest rate trends is useful here. From the peak in the early 1980s through 2020, rates declined gradually but persistently, with short-term fluctuations tied to the business cycle and economic events. This era is widely described as a 40-year bull market in bonds, given that falling rates made existing bonds more attractive and helped support both portfolios and the broader economy.
Higher interest rates ripple through many parts of the economy, with the housing market among the most affected. According to Freddie Mac, the average 30-year fixed-rate mortgage has moved back above 7% after dipping toward 6% at the start of the year. This has contributed to what economists call the “lock-in” effect, where homeowners who locked in low rates in prior years have little incentive to sell, which limits housing market activity.
Interest rate movements are inherently difficult to forecast and are subject to sharp swings, particularly given ongoing uncertainty in oil markets and the labor market. Even so, rates remain near multi-decade highs, and this is a development that investors cannot afford to overlook.
Earnings growth and AI investment are supporting a range of asset classes
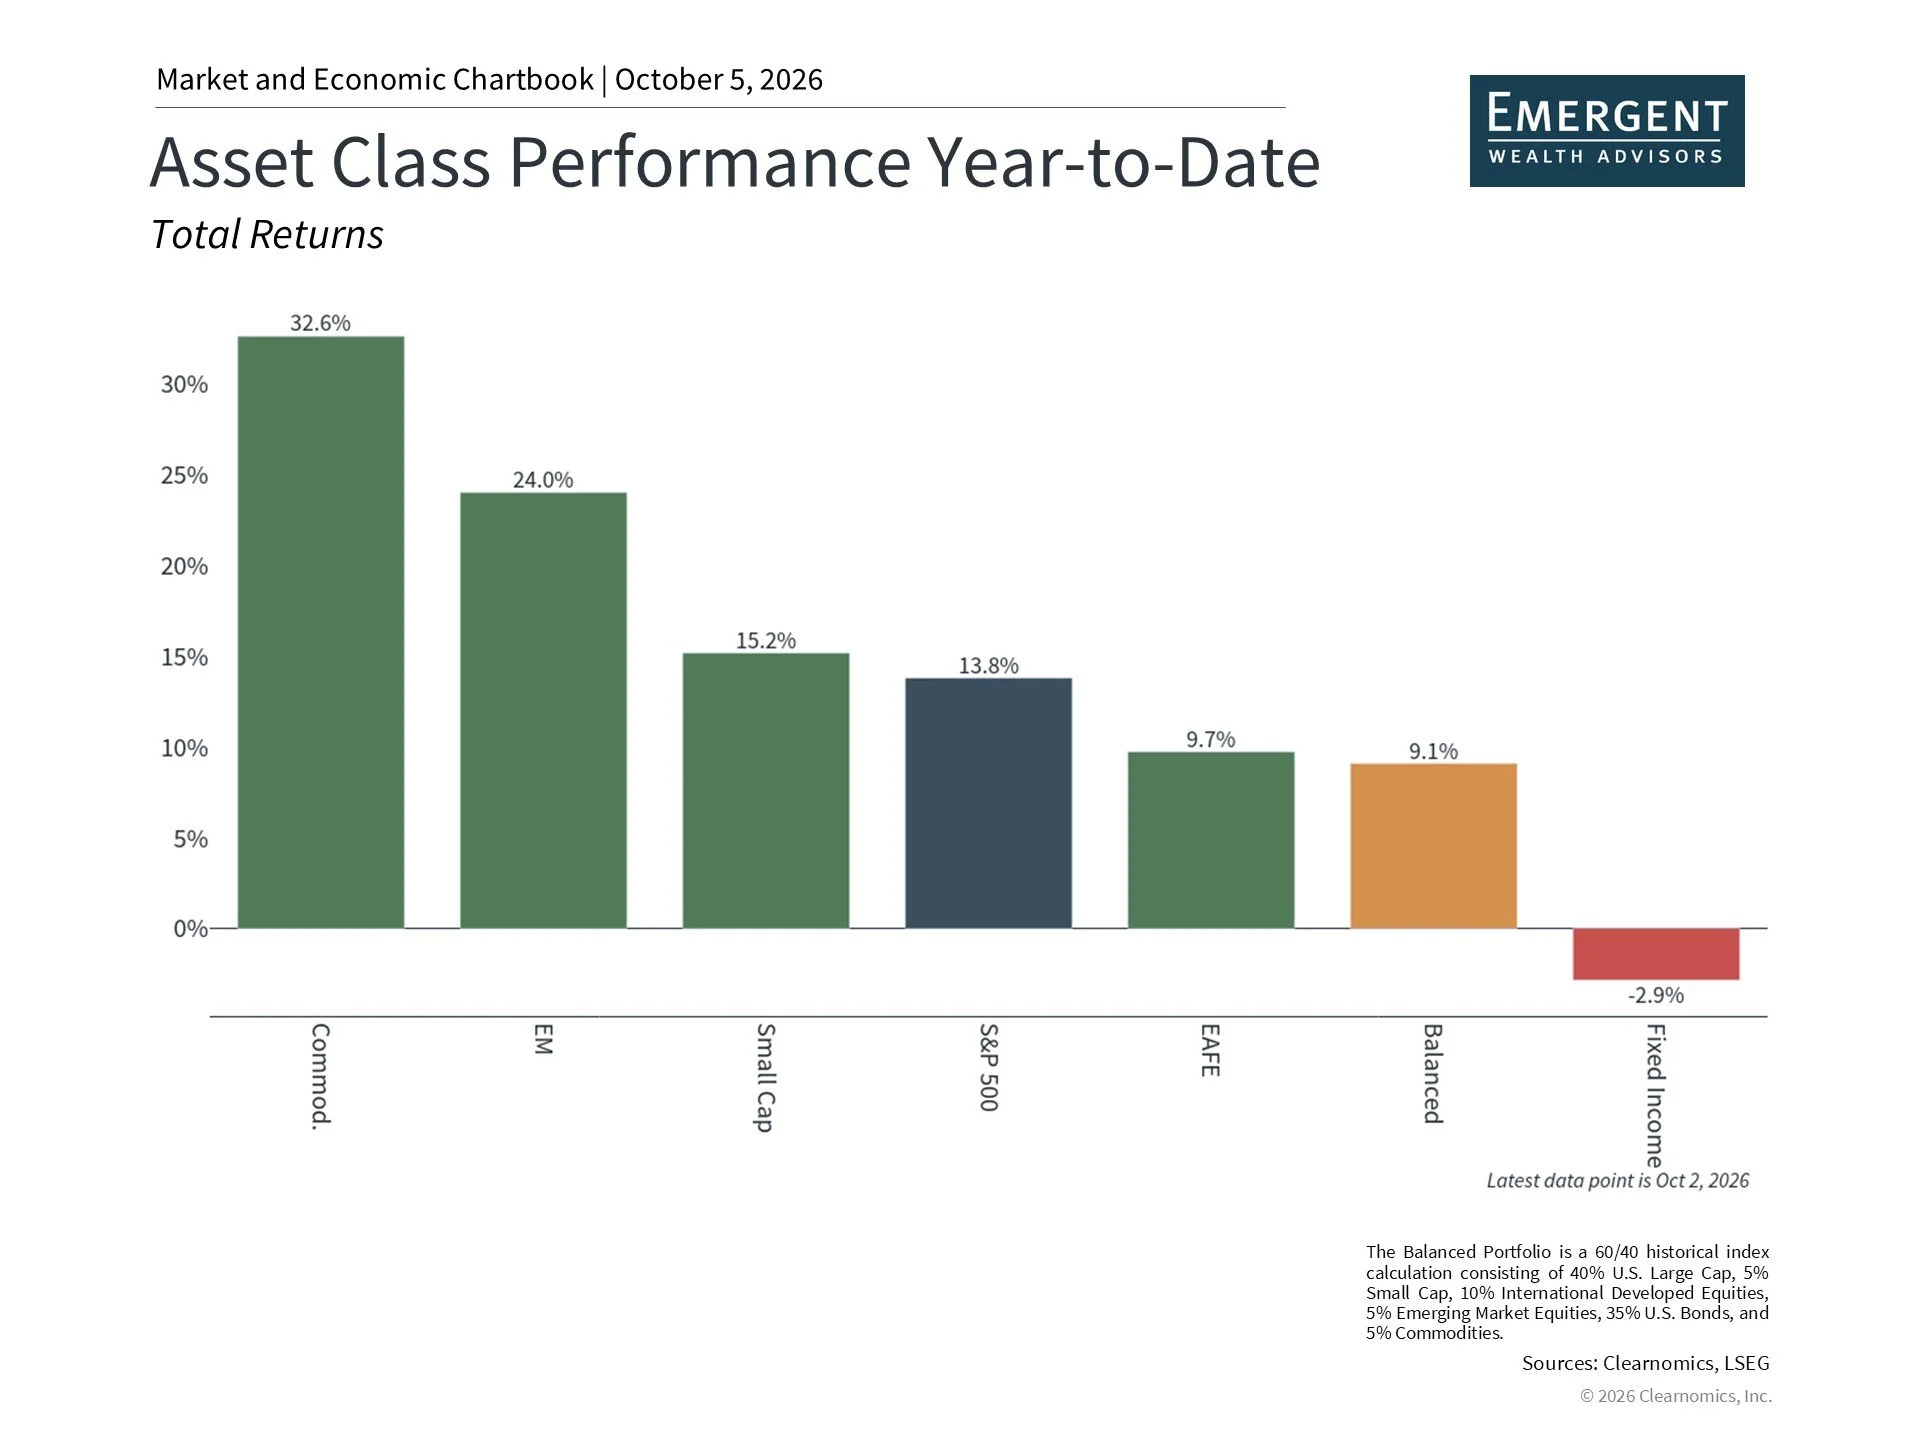
Despite recurring bouts of near-term uncertainty, the S&P 500, Nasdaq, and Dow Jones Industrial Average all reached new all-time highs during the third quarter. A strong economy and structural trends such as AI infrastructure investment have supported corporate profitability. Current consensus estimates suggest that the S&P 500 could experience earnings growth of over 30% for the next twelve months across 2026.
This year’s positive returns have not been confined to U.S. large cap equities. Small cap stocks, for instance, faced some difficulty in the third quarter but have still outperformed on a year-to-date basis, as many of these companies play meaningful roles in the AI supply chain. Other regions have similarly benefited from AI-related themes, particularly semiconductor companies in Asia, which has helped support the MSCI Emerging Market index despite a third-quarter decline.
Commodities have also added to portfolio performance, though for distinct reasons. The ongoing conflict in the Middle East pushed oil prices from roughly $70 per barrel in early July to above $100 in September. Copper reached a new all-time high on the back of mine supply shortfalls and structural demand from AI infrastructure, while diesel hit a record price due to severely constrained global refining capacity.
The breadth of asset class contributions underscores the value of a thoughtful asset allocation strategy. This will only become more relevant in the fourth quarter as questions around monetary policy, Treasury yields, and oil prices remain at the forefront.
The Fed’s first rate hike in three years
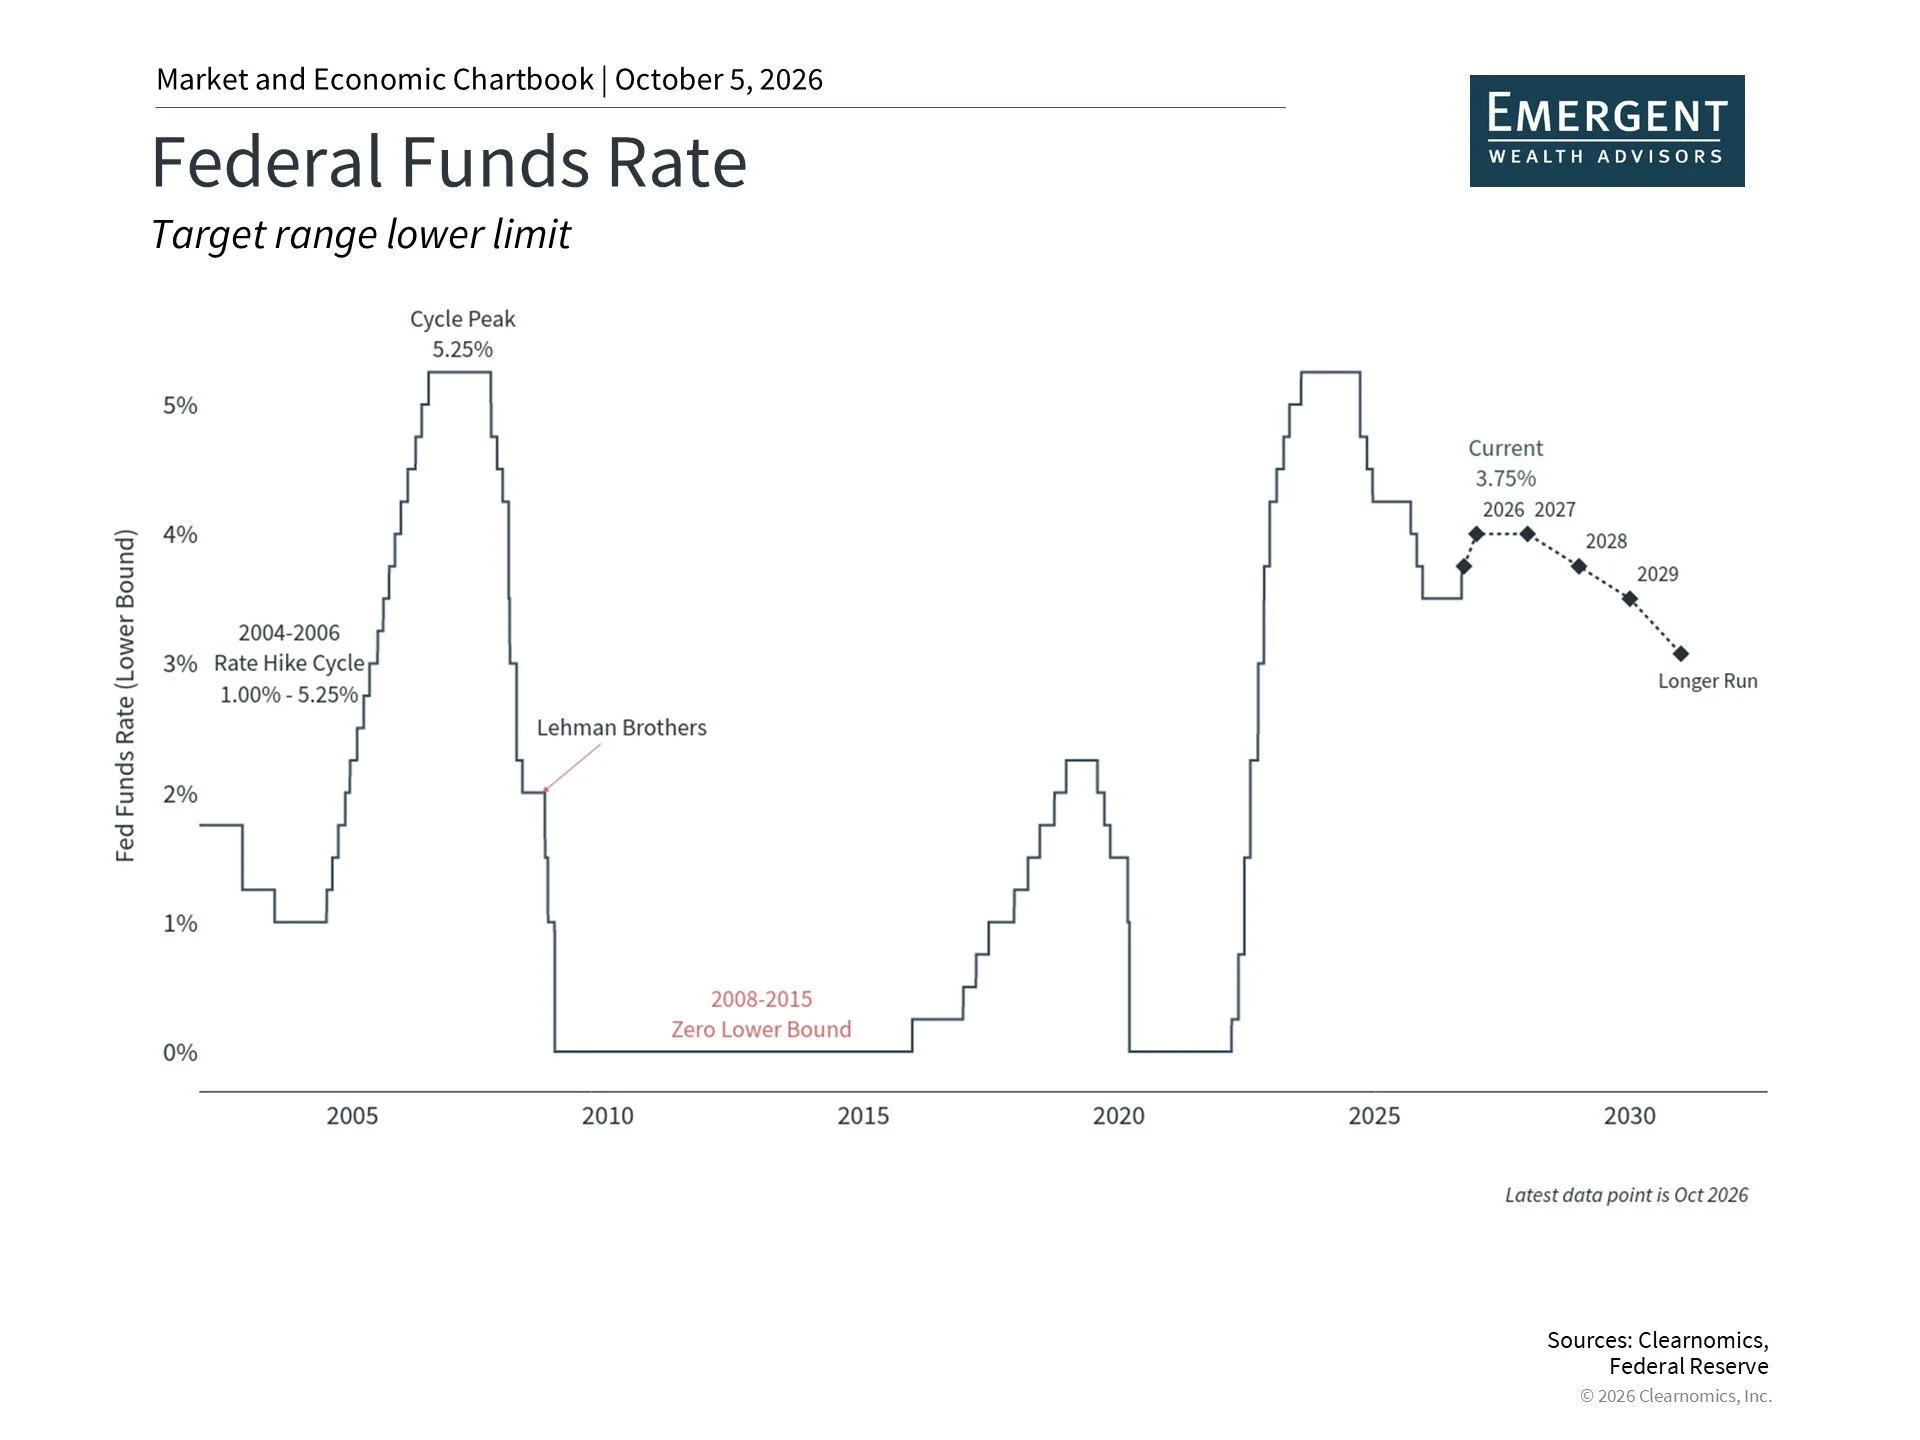
At its September meeting, the Fed lifted policy rates by one-quarter of a percent to a range of 3.75% to 4.00%. This marked the first rate increase in three years, coming after a period of cuts that ran from September 2024 through December 2025, as illustrated in the chart above. Markets had assigned better than a 90% probability to this outcome ahead of the announcement, so while there was some immediate volatility, the broader market absorbed the move without significant disruption.
What distinguishes this particular hike is its primary motivation: higher energy prices. Economists often describe this as “cost-push inflation,” meaning that supply disruptions have driven prices higher. The Fed cannot address geopolitical events through interest rate policy, but it can act to prevent rising energy costs from filtering into other inflation categories that affect consumers and businesses.
Projections from Fed officials currently suggest the central bank could implement one additional rate increase this year before pausing through 2027, with only a gradual decline in rates expected thereafter. These projections are subject to change as economic conditions evolve, and should be interpreted with appropriate caution.
It is natural for investors to view tighter monetary policy as a potential headwind for markets. In practice, the impact depends heavily on the reason behind the rate increases. Historically, it is not uncommon for both markets and interest rates to rise simultaneously, particularly later in the business cycle when growth, corporate earnings, and capital investment are all solid. The third quarter illustrated this dynamic well, with major stock indices reaching new highs even as rates climbed. Of course, monetary policy is only one of the forces shaping the outlook, alongside the political calendar.
Midterm elections and the landscape of policy uncertainty
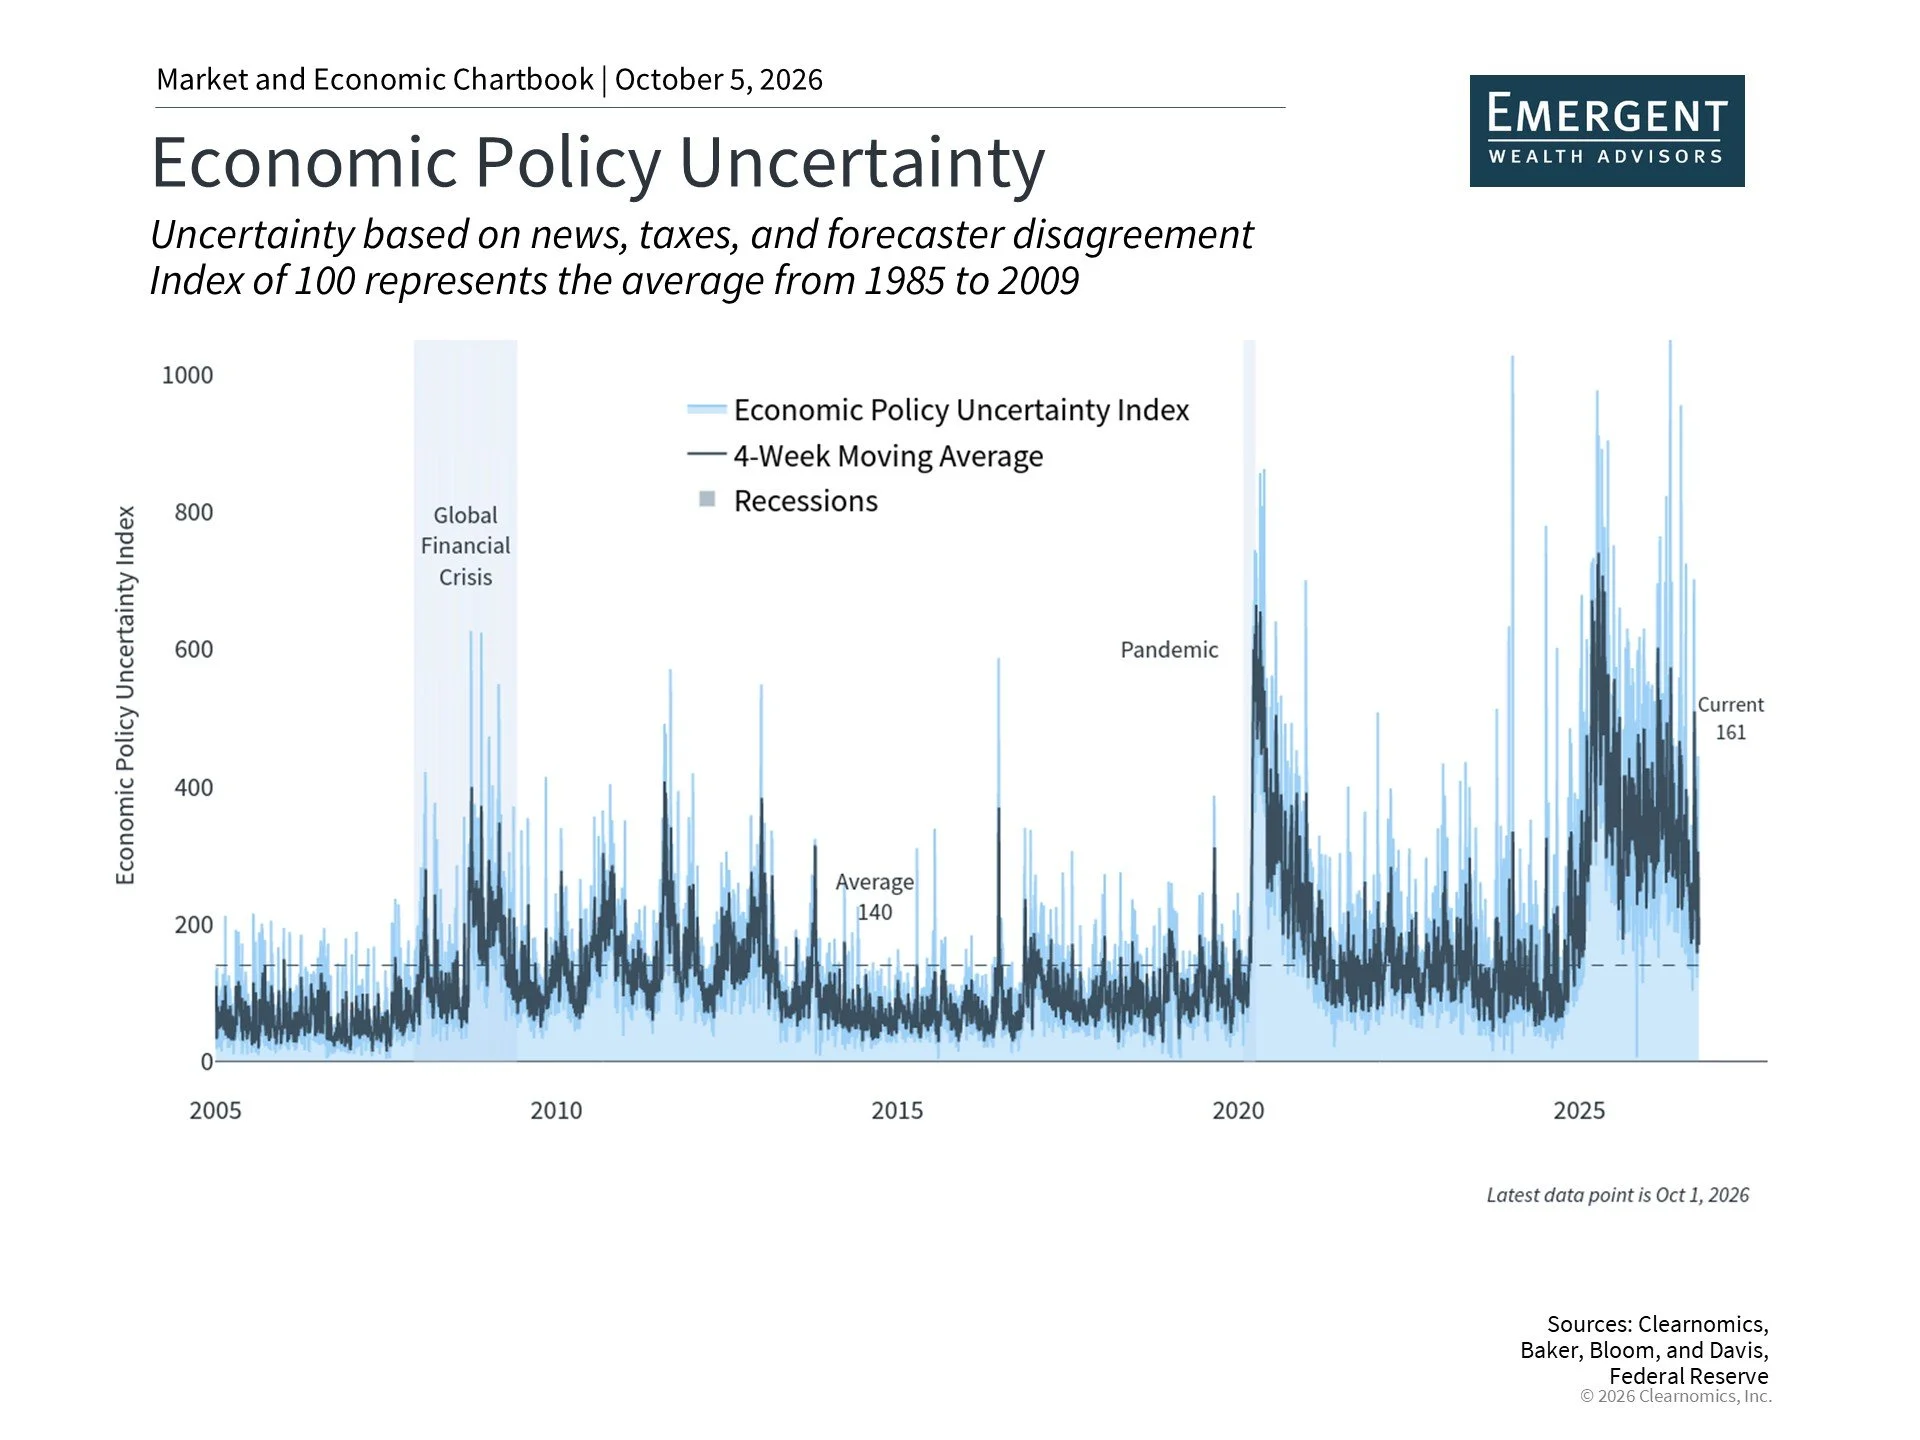
As citizens, voters, and taxpayers, elections rank among the most consequential events in public life. They set the course for policy on issues ranging from entitlement programs and taxes to the federal debt, and they reflect the values that inform new legislation. When it comes to investing, however, it is important for investors to avoid letting political views drive portfolio decisions.
This November’s midterm election is unfolding against a complex backdrop of tariffs, geopolitical conflict, inflation, and questions surrounding AI. As the chart above illustrates, significant economic policy uncertainty over the past two years has produced short-term market volatility. At the same time, markets have repeatedly demonstrated an ability to stabilize and recover in ways that can surprise investors. While past performance is no guarantee of future results, it is important not to overreact to short-term political headlines.
More broadly, the assumption that politics should dictate stock market performance, or that election years are inherently more volatile, is not well supported by history. The S&P 500 has averaged annual total returns of 8.6% across midterm election years since 1933. History also shows that markets have performed well on average under various configurations of Congress. It is not uncommon for the sitting president’s party to lose its congressional majority during a midterm election, as occurred under Biden, Trump’s first term, Obama, and Clinton, among other recent examples.
Beyond the question of which party controls the White House or Congress, other sources of political uncertainty warrant attention. The size of the national debt and budget deficit is a concern for many investors. Total federal debt has recently surpassed $40 trillion for the first time, equivalent to nearly $120,000 per American. The annual budget deficit is also projected to exceed $2 trillion for the government’s 2026 fiscal year. Over time, these trends could increase borrowing costs for the government and raise the annual interest payments it must make.
While many of these challenges are genuine, the key for investors is to distinguish between what they can and cannot control. Holding a portfolio constructed to perform across a range of economic and political environments remains more effective than attempting to predict the outcome of a single election or the precise path of the budget deficit.
AI, productivity growth, and sector performance
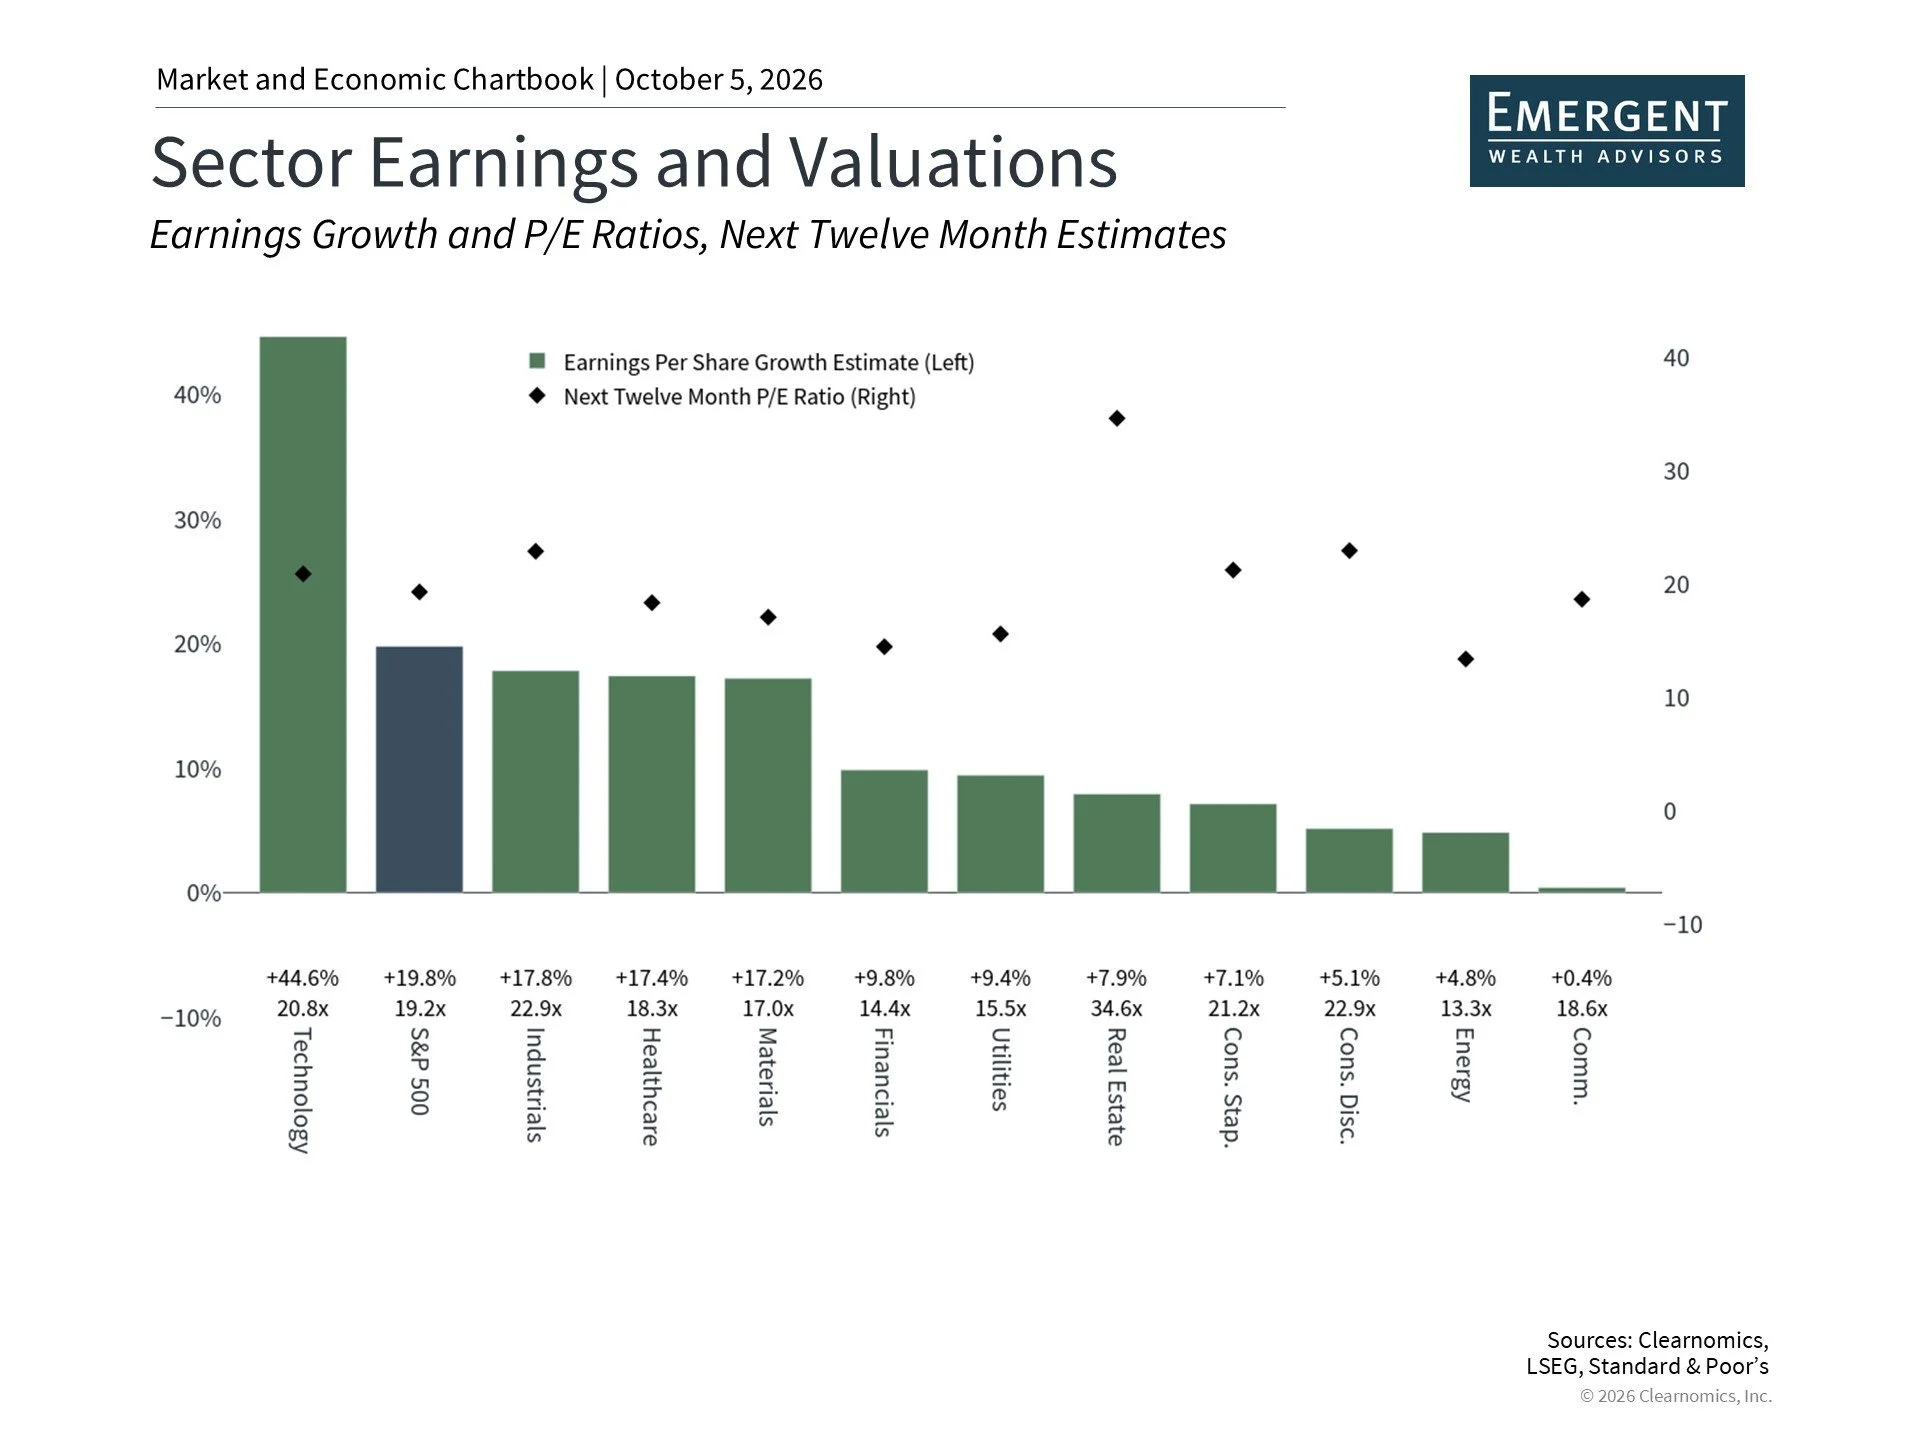
AI and related technology trends have been among the most powerful drivers of market performance over the past decade. These themes have not only generated strong returns for groups such as the Magnificent 7, but have also directly shaped fundamental earnings trends across sectors. The chart above highlights the divergence in earnings growth between Information Technology and the other ten S&P 500 sectors.
This degree of “concentration risk” is a concern for some investors who worry that market performance is increasingly dependent on a small number of stocks. While many technology-related areas of the market continue to deliver strong results, other sectors have also contributed to healthy returns over the past year. These sectors are experiencing above-average earnings growth that helps underpin their valuations. The energy sector, for instance, has benefited from elevated oil prices and is the best performing sector with a 37.4% year-to-date gain through the third quarter.
Much of the AI-driven growth is tied to the buildout of infrastructure, including data centers. Perhaps the most consequential open question is whether AI will translate into genuine productivity gains across the broader economy. The core benefit of the information technology revolution and widespread internet adoption was a meaningful boost to productivity. So far, the 2020s have seen average productivity growth of 2.1% per year, compared to just 1.2% in the 2010s. Whether AI and other emerging technologies can sustain or accelerate this trend remains an open question with significant implications for markets and the economy in the years ahead.
Given the complexity of the current environment, maintaining a longer-term perspective remains essential. The largest technology companies, for example, took decades to reach their current scale, even if markets were enthusiastic about their potential in the 1990s. In the same way, understanding how AI trends interact with higher interest rates and a new Fed rate hike cycle can help investors stay focused as the year draws to a close.
The bottom line? Stocks reached new highs in the third quarter, with many asset classes contributing to portfolios, despite bonds struggling as interest rates rise. As new developments unfold and the midterm election approaches, investors should continue to stay balanced and focus on financial goals.