

There is an old saying that smooth seas do not make skillful sailors. In the world of investing, the first half of 2026 has put that wisdom to the test. Investors confronted significant challenges, including the war in Iran, oil prices pushing inflation to multi-year highs, and ongoing questions surrounding artificial intelligence (AI). Despite these headwinds, markets climbed to new all-time highs, corporate earnings grew at a double-digit pace, and a broad range of asset classes delivered positive results. The first six months of the year have served as a powerful reminder of why staying invested and maintaining a longer time horizon remain so important.
This lesson carries even greater weight today, as the business cycle has now entered its seventh year while the market cycle is approaching its fifth. For many investors, it can feel as though the same concerns keep resurfacing, including inflation, Federal Reserve policy, and valuations. Navigating these challenges is not a sign of an unusual environment. It is simply part of investing, and it is precisely why those who stay the course tend to be rewarded over the long run.
The second half of the year will undoubtedly bring its own unexpected developments, from new turns in the Middle East conflict to the upcoming midterm elections and potential market activity such as initial public offerings (IPOs). Maintaining perspective as these events unfold will be essential for investors seeking to protect and grow their wealth.
Key market and economic highlights from the first half of 2026
• The S&P 500, Nasdaq, and Dow Jones Industrial Average returned 9.6%, 12.8%, and 8.9% year-to-date through the end of June, respectively. The second quarter was historically strong, with the S&P 500 returning 14.9%, the Nasdaq 21.4%, and the Dow 12.9%.
• The Bloomberg U.S. Aggregate Bond Index rose 0.6% year-to-date. The 10-year Treasury yield ended the second quarter at 4.47%, up from 4.17% at the start of the year.
• Developed market international stocks (MSCI EAFE) gained 7.7% and emerging market stocks (MSCI EM) returned 22.7% year-to-date, both measured in U.S. dollar terms.
• The Bloomberg Commodities Index rose 12.3% year-to-date, driven by a strong first quarter gain of 23.3%, followed by a decline of 8.9% in the second quarter.
• Brent crude peaked just under $120 per barrel in May before closing the quarter at $73 per barrel.
• Gold prices fell to $4,007 per ounce while Bitcoin declined to a recent low of $58,633.
• Headline CPI rose 4.2% year-over-year in May, driven largely by energy prices. Core CPI, which excludes food and energy, rose 2.9%.
• The Federal Reserve kept rates unchanged at 3.50% to 3.75% throughout the first half of the year. Kevin Warsh was sworn in as Fed Chair in May.
The business cycle is now in its seventh year of expansion
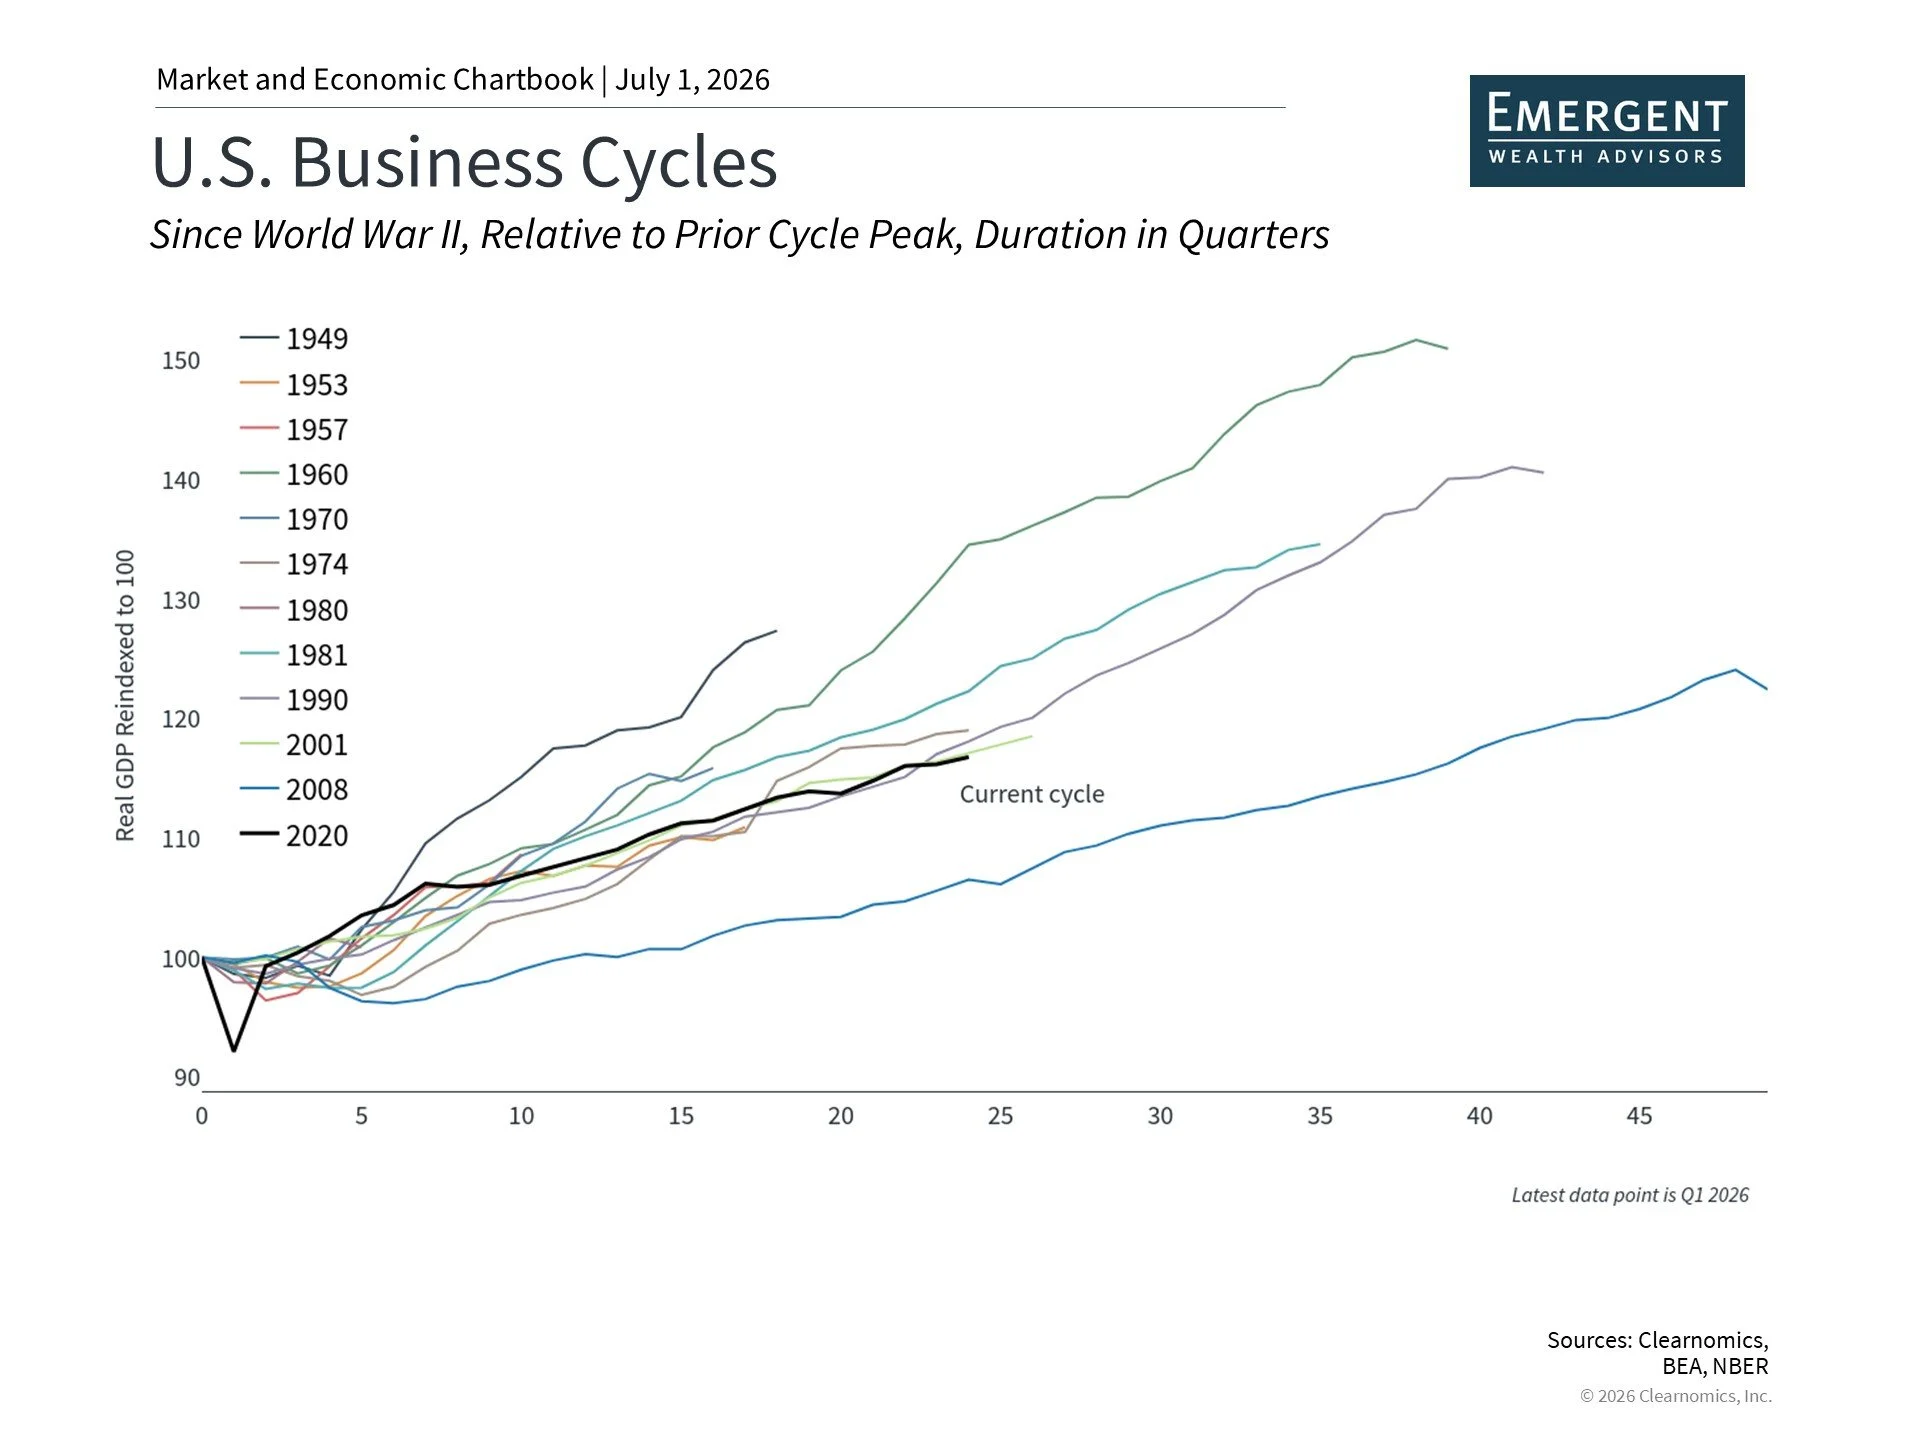
It may come as a surprise to some investors that the current business cycle began in April 2020, amid the pandemic, and just passed its sixth anniversary in the second quarter. There have been several periods when investors and economists worried a recession was imminent, including when inflation peaked in 2022 and when tariffs disrupted trade last year. Through each of these challenges, the economy has proven resilient, continuing to expand despite significant headwinds.
The business cycle touches all aspects of investing and financial planning, from mortgage costs to annual pay raises. A healthy economy supports consumer spending and business investment, which in turn fuels corporate earnings and ultimately stock market returns. While the stock market and the broader economy are not identical, they are closely connected. The chart above places the current cycle in historical context. The longest business cycles on record, including the one that followed the 2008 financial crisis and the 1990s dot-com expansion, lasted a decade or more.
Where does the economy stand today? Inflation remains elevated but could ease if oil prices hold near current levels. The job market has regained momentum, reversing last year's concerns about a slow pace of hiring. The dollar has stabilized and recently rebounded. Trade remains uncertain but has shown signs of settling. Business investment has accelerated, and consumers, while feeling pessimistic, continue to spend on both essentials and discretionary items. On balance, the economy appears healthy despite some mixed signals, which historically bodes well for financial markets over the long run.
Broad asset class performance has benefited diversified portfolios this year
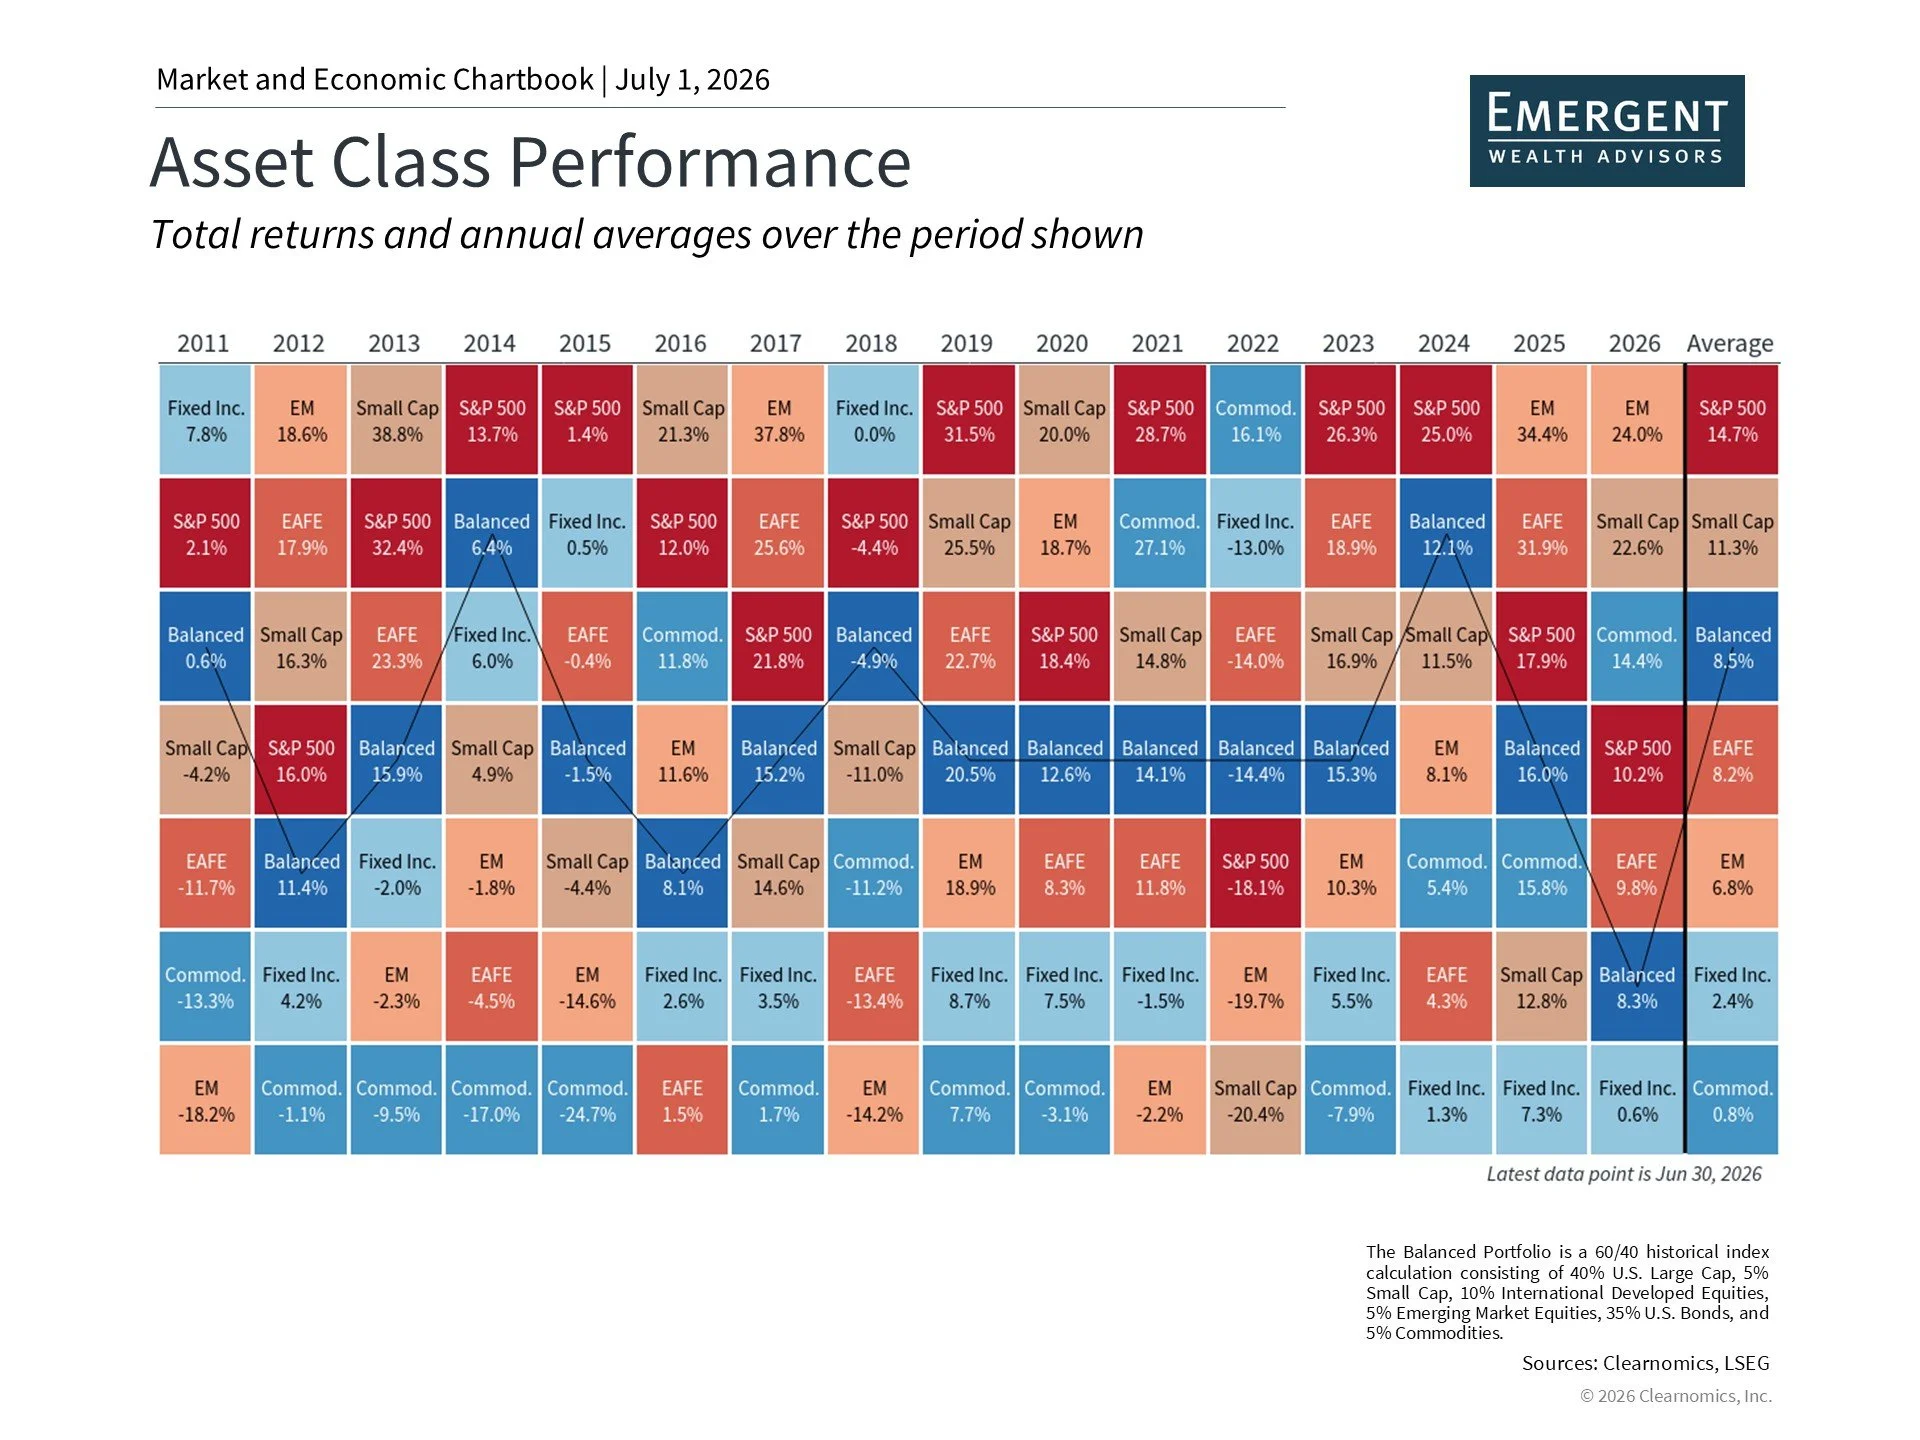
A wide range of global asset classes has contributed positively to portfolios so far this year, continuing the trend established in 2025. As shown in the chart above, gains were not limited to large cap stocks as represented by the S&P 500. Small caps, emerging markets, and commodities all added value. The second quarter, in particular, ranked among the strongest on record, partly because the onset of the war in Iran meant that the market recovery began at the very start of April.
Several themes have driven these returns, including economic strength, hopes for a peace agreement in Iran, and enthusiasm surrounding AI. Many of these factors have supported corporate earnings growth, with profits rising over 20% over the past twelve months for S&P 500 companies.
This favorable market environment has also spurred a wave of high-profile IPOs, including SpaceX in the second quarter and the anticipated listings of OpenAI and Anthropic, both AI companies.
Investors often focus on the initial days of an IPO when media attention is highest, but the real benefits typically accumulate over a much longer period. These listings expand the investment opportunity set for all investors, which is particularly meaningful given that many companies have been choosing to remain private for longer periods. What ultimately matters is how these businesses perform across years and decades, through multiple market and economic cycles.
These positive trends do mean that U.S. stock valuations are historically elevated. The S&P 500 currently trades at a price-to-earnings ratio of 20x, above the long-term historical average of 16x.
Such valuation ratios are not reliable predictors of short-term market direction, but they do serve as useful guides for constructing long-term portfolios, particularly when considering other asset classes and risk management. Taken together, this year’s results underscore the value of maintaining balance across a diversified portfolio.
Inflation remains elevated, though easing oil prices offer some relief
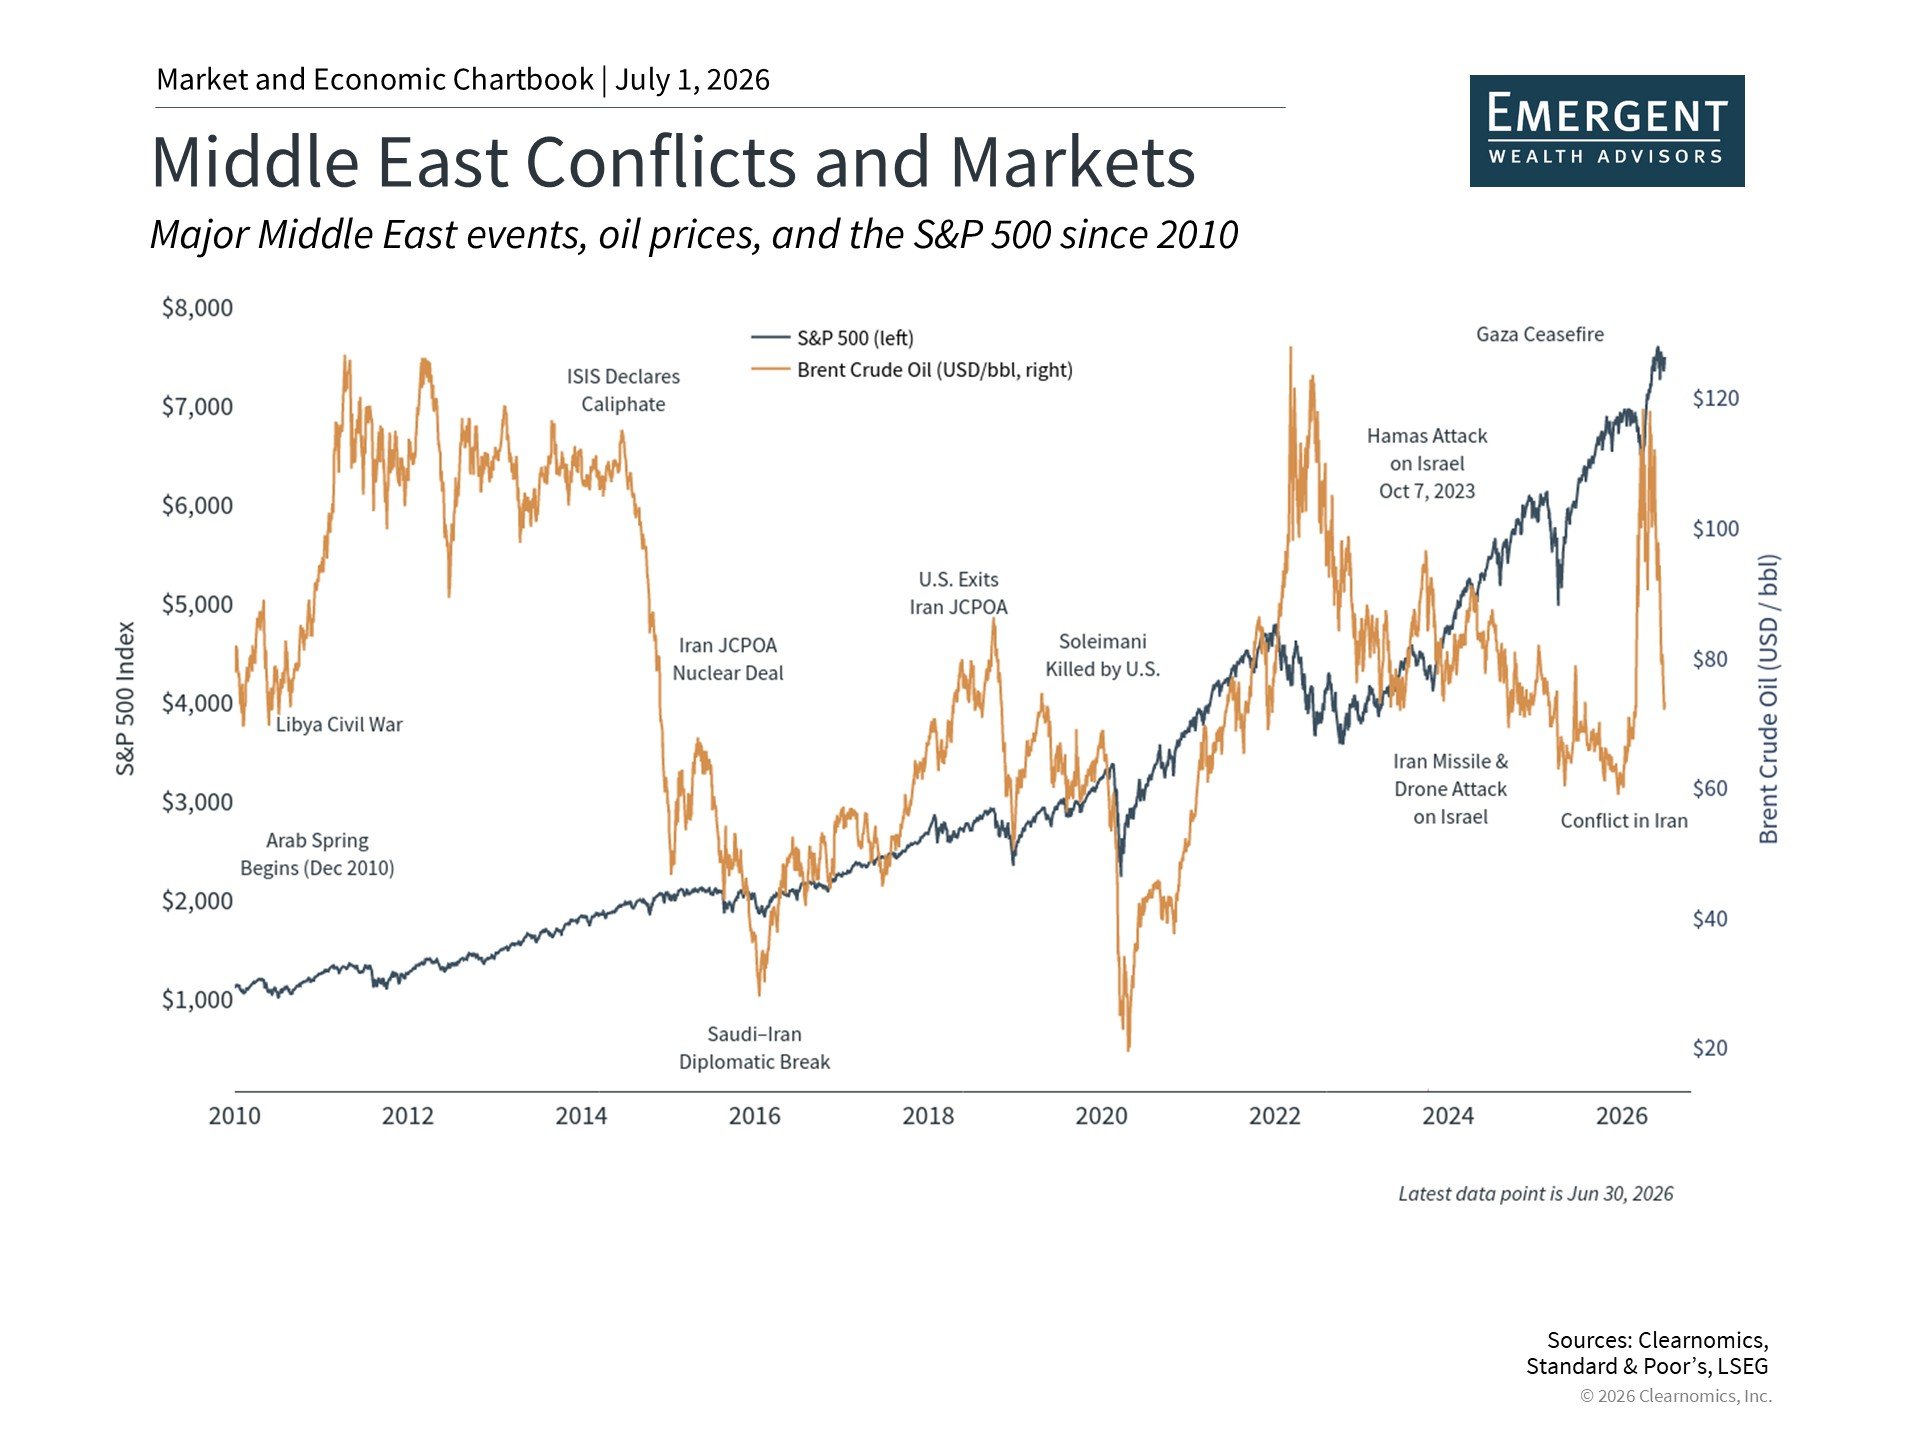
The conflict in Iran has affected the U.S. economy most directly through energy markets. Disruptions to oil transportation through the Strait of Hormuz pushed Brent crude to nearly $120 per barrel before prices retreated sharply. In recent weeks, oil has fallen to around $70 per barrel, near pre-conflict levels. Gasoline prices followed a similar trajectory with a delay, peaking above $4.50 per gallon nationally before pulling back below $4.00 per gallon.
These energy price swings have had a direct impact on inflation. The Consumer Price Index rose 4.2% year-over-year in May, its highest reading in several years, with the gasoline component jumping 40.5% over the same period. Notably, core CPI, which excludes food and energy, rose only 2.9%, indicating that inflationary pressures remain concentrated in fuel prices rather than spreading broadly through the economy.
With oil prices declining recently, many economists are hopeful that inflation may be near its peak. This pattern is consistent with past geopolitical shocks that disrupted oil supply, such as Russia’s invasion of Ukraine in 2022, along with other historical episodes shown in the chart above. Once those situations stabilized, oil prices typically recovered, and inflation rates moderated over time.
Market volatility has remained within manageable bounds
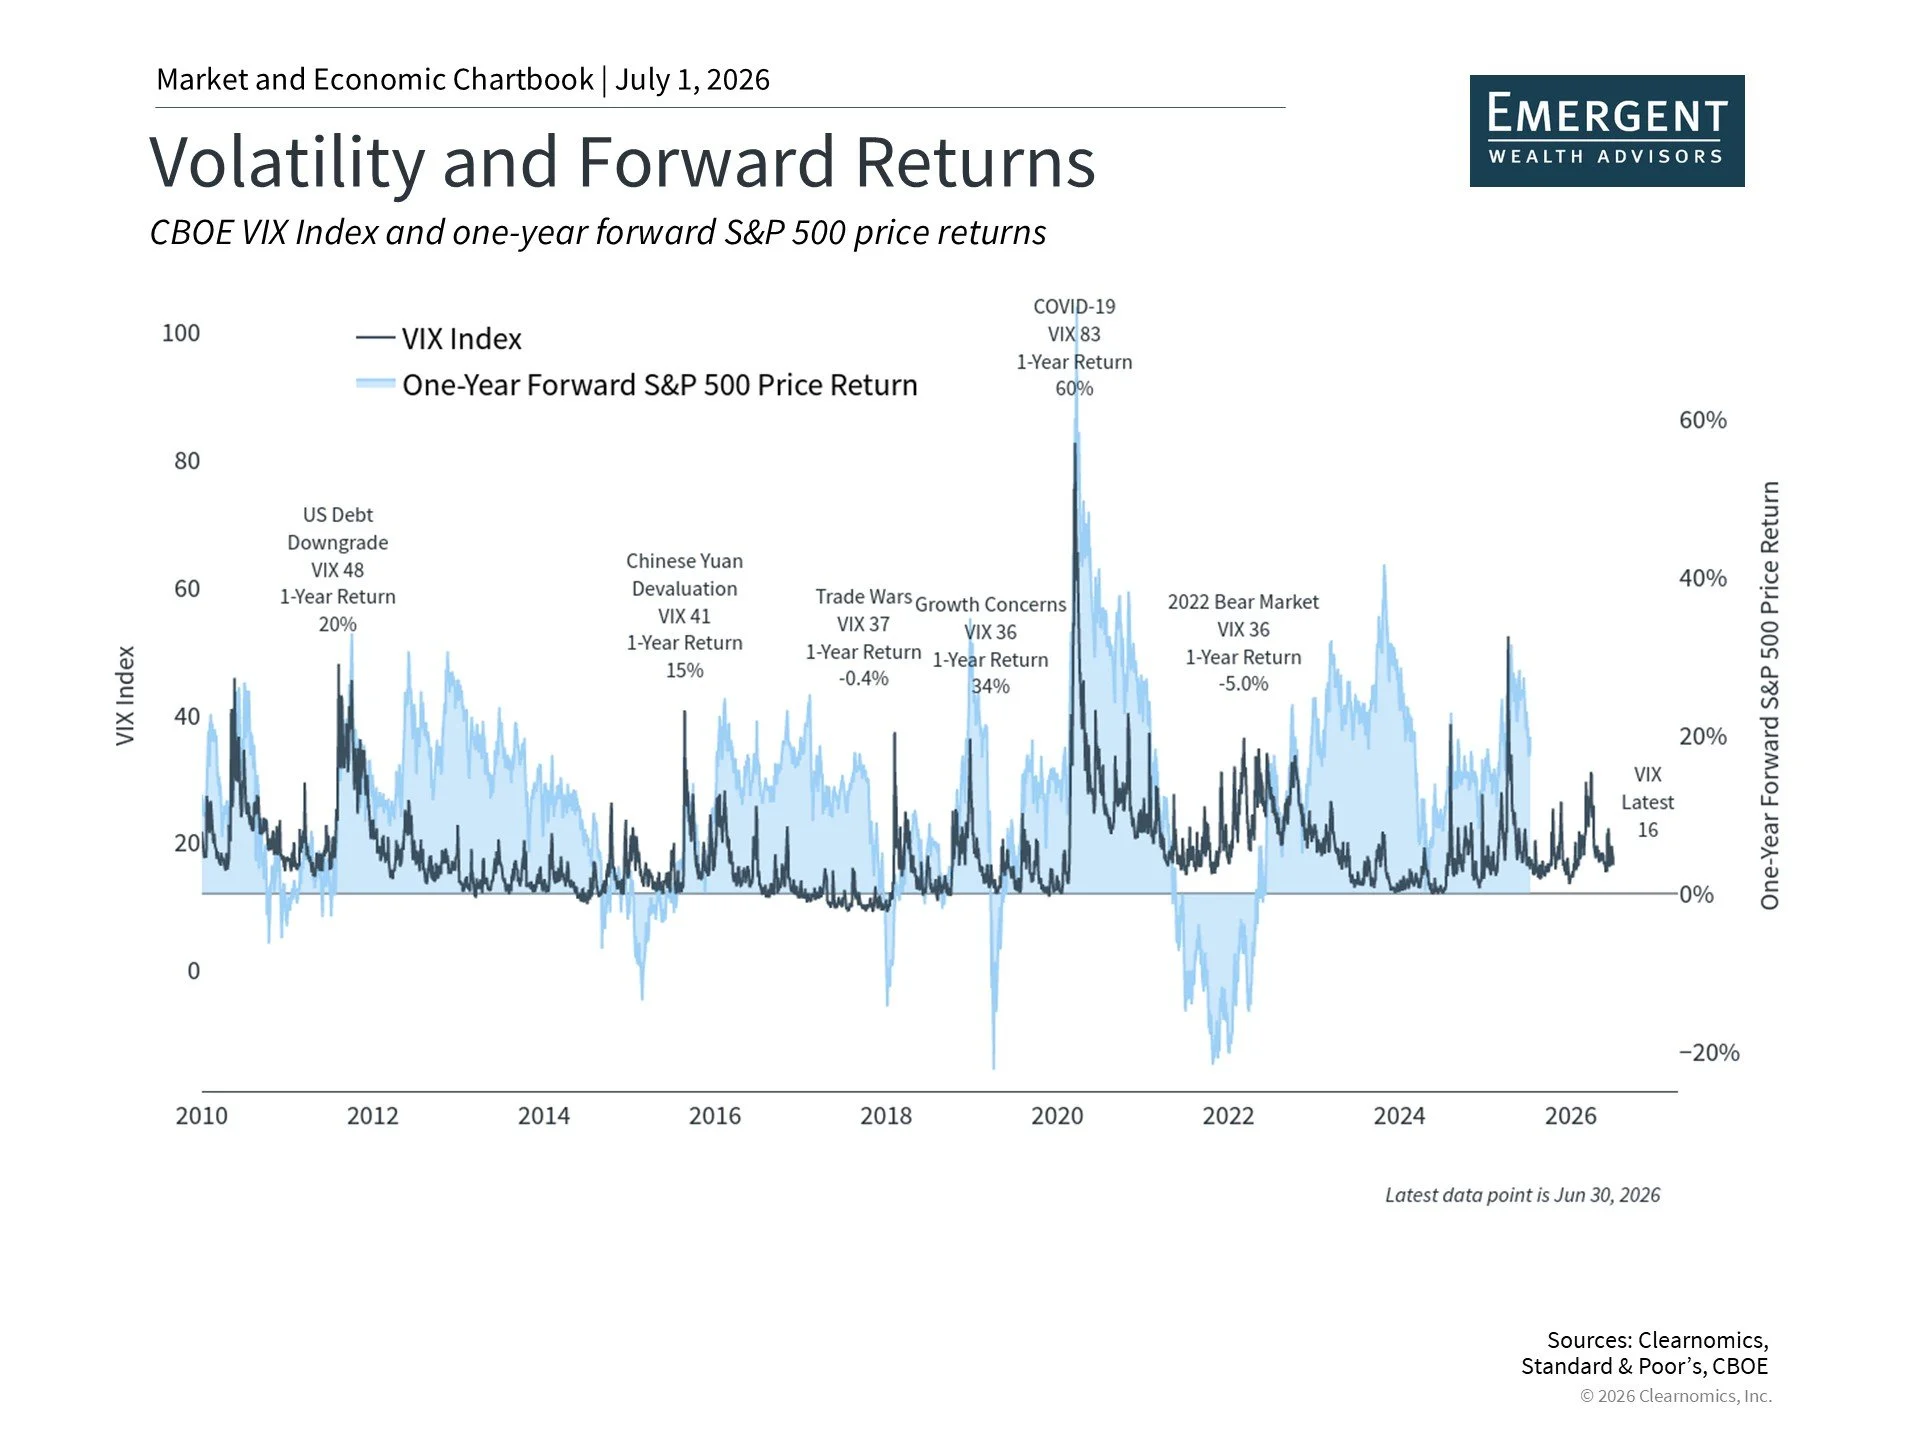
Investors have become accustomed to brief bouts of volatility triggered by macroeconomic events. Tariffs, the Middle East conflict, and uncertainty surrounding Fed policy have each contributed to short-lived market swings over just the past year. This pattern is visible in the VIX, a widely used measure of stock market volatility. Encouragingly, the current VIX reading of 16 sits below its long-term average of 18.4 and well below recent peaks, as shown in the chart above. This also illustrates that periods of elevated volatility can present meaningful market opportunities for those who remain invested.
Another way to gauge the impact of market moves on investors is to look at the largest pullback each year. So far in 2026, the S&P 500’s largest peak-to-trough decline has been 9%. While such pullbacks are never comfortable, markets have a tendency to rebound when investors least expect it. The S&P 500 has not only recovered fully from its earlier decline but has gone on to reach 24 new all-time highs so far this year.
The first half of 2026 reinforces a fundamental investing truth: the greatest risk during periods of uncertainty is often not the volatility itself, but the way investors respond to it. Attempting to time the market during turbulent stretches can frequently backfire. A better approach is to hold a well-constructed portfolio designed to endure all phases of the market cycle while remaining aligned with long-term financial goals. This kind of discipline will be just as important in navigating whatever the second half of the year may bring.
The cost of moving to the sidelines can be significant
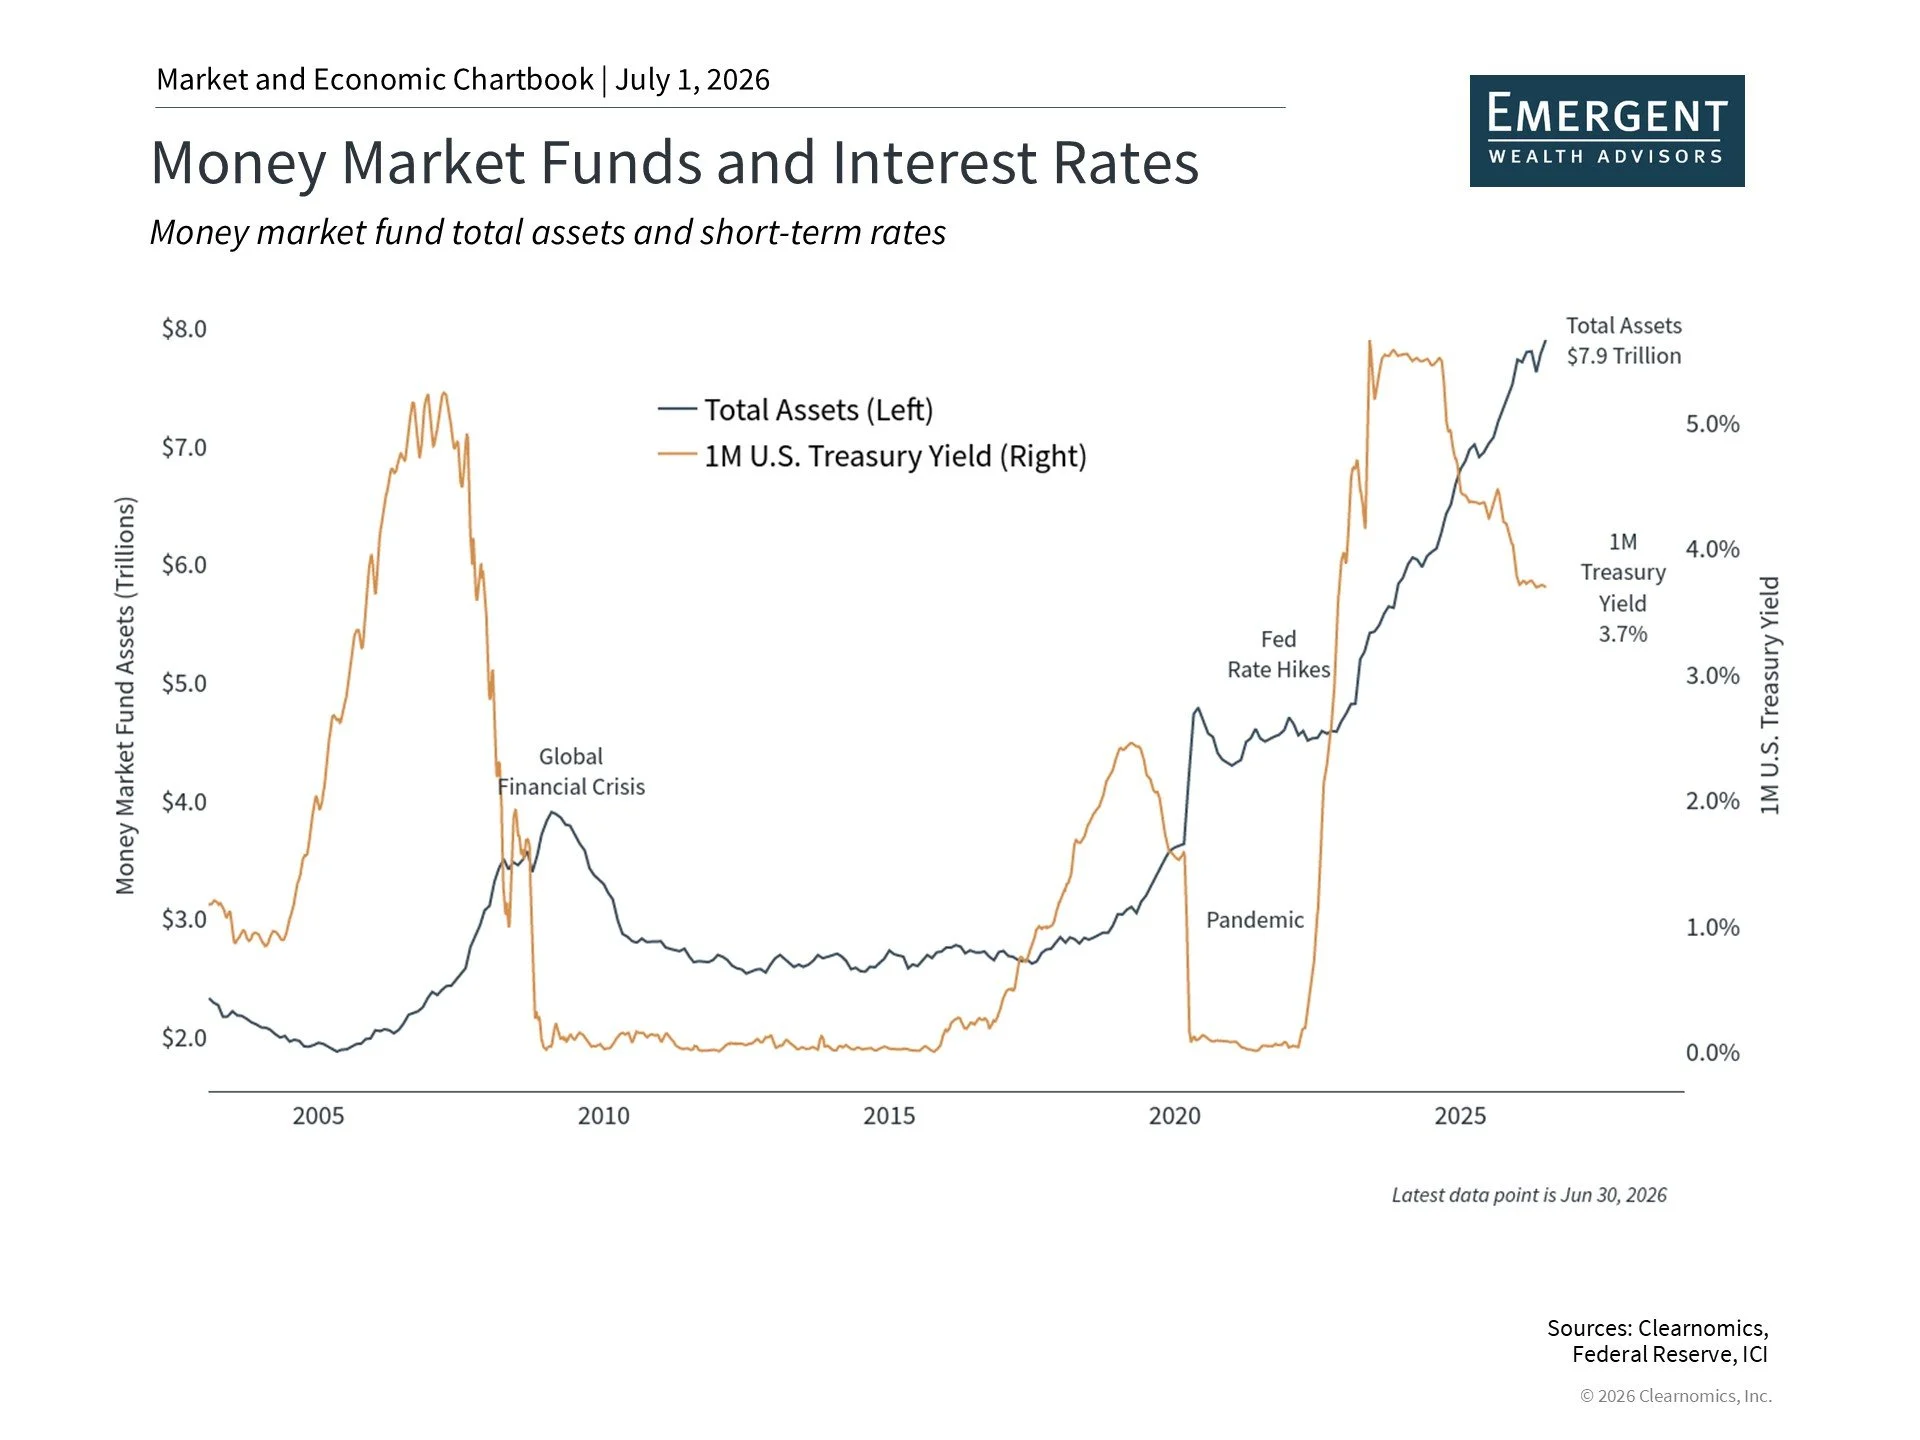
One common consequence of investors exiting the market during volatile periods is the accumulation of what is often called “cash on the sidelines.” The core challenge with this approach is knowing when to re-enter the market. The chart above illustrates just how much capital is currently sitting in cash. Money market fund assets have reached a record $7.9 trillion, more than double their pre-pandemic level when interest rates were near zero. This reflects both the market uncertainty of recent years and a period of higher short-term rates that made cash more appealing.
Although cash can feel safe and stable, the challenge is that cash yields frequently fail to keep pace with inflation. The current average rates on certificates of deposit, for instance, mean that the real income from cash is negative after adjusting for inflation.
Even when nominal yields on money market funds and short-term instruments appear attractive, maintaining those rates over time presents its own difficulties. As a result, the purchasing power of cash holdings can erode steadily.
This is why holding a balanced portfolio that can participate in growth, generate income, and preserve capital remains the more prudent path. As the market and economic cycle continues to evolve, this principle will only become more relevant for long-term investors.
The bottom line? The first half of 2026 has rewarded investors who stayed diversified and maintained a long-term perspective, even as geopolitical and economic headlines created short-term uncertainty.